Streamline Consolidation With Power Query
How to use Power Query in Excel to combine trial balances across group entities, cleanse the data, build a pivot table and refresh the whole consolidation in seconds each reporting cycle.

Xian Hui
23 June 2025
Quick answer
How can you streamline consolidation using Power Query in Excel?
Power Query is an extract, transform, load tool built into Excel. It connects your consolidation workbook to a folder of trial balance files, then cleanses and combines them automatically. You build a pivot table once, and each period you drop in updated trial balances and click Refresh. A task that once took hours is completed in seconds, with far less manual copying.
Streamline Consolidation With Power Query
Written by Ng Xian Hui, Founder of Backbone. Originally published on the Chartered Accountants Lab (ISCA).
Consolidation is often seen as a challenge, especially for junior accountants. But it can be a breeze if done the right way, by harnessing the power of Excel.
Key takeaways
- Power Query lets you create connections between a workbook and various data sources, such as another workbook, multiple workbooks in a folder, a database, or even data transmitted through an application programming interface (API).
- Any changes to the data can be updated simply by clicking the refresh button in Excel to repull the data.
- Working at the general ledger account level, with a common chart of accounts, lets intercompany accounts eliminate naturally when you map them to the same caption.
What is Power Query, and why does it matter for consolidation?
The visual below shows a typical consolidation worksheet. You have the list of accounts, and group entities in the columns. You need to bring in the trial balance data of each group entity into this worksheet. This can be achieved using formulas or functions, or using Power Query.
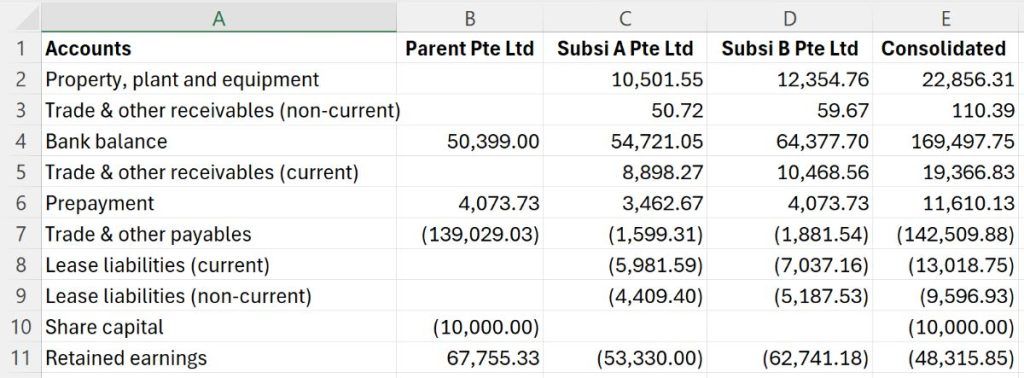
Power Query is an extract, transform, load (ETL) function in Microsoft Excel. It was first introduced over 10 years ago as an add-in and later became a core feature in Excel. This marked a significant enhancement in Excel's data processing capabilities, making it easier for users to handle complex data transformations without needing to know how to code.
Power Query allows users to create connections between a workbook and various data sources, such as another workbook, multiple workbooks in a folder, a database, or even data transmitted through an API. Once the connection is defined, any changes to the data can be updated simply by clicking the refresh button in Excel to repull the data. This feature eliminates the repetitive tasks of manually pulling and cleansing data that accountants typically do in every reporting cycle. For more background, see Microsoft's guide to Power Query in Excel.
How do you set up consolidation with Power Query?
We will jump straight into the steps to get things done. The tips that follow are just as important, so read those before you start on live data.
1. How should you prepare the trial balances?
First, download the trial balance for each group entity from your accounting system. To combine the trial balances of multiple group entities, the structure should be relatively consistent. The data should ideally be in the same worksheet, start at the same row and have the same heading labels, although the sequence of the columns does not necessarily need to be identical.
If the trial balance format is not consistent across the group entities, you will need to perform intermediary steps to make it consistent. This can be done using Power Query or other Excel functions.
All the trial balances should be saved into the same folder and renamed to reflect the respective entities' names, like this:
- Parent Pte Ltd.xlsx
- Subsi A Pte Ltd.xlsx
- Subsi B Pte Ltd.xlsx
2. How do you load the data into Excel?
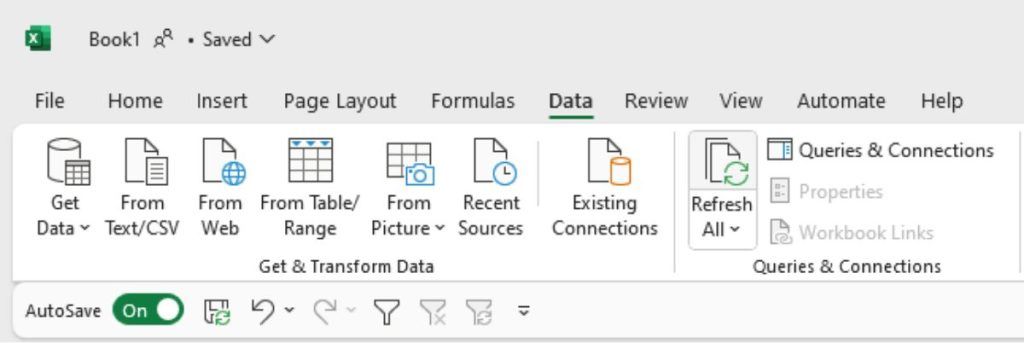
In Excel, create a new workbook. Then go to the Data tab, navigate to the Get & Transform Data group, and click Get Data > From File > From Folder. This illustration uses Excel 365. If you are using an older version of Excel, the buttons may be in a different location, but you should find them within the Data tab.
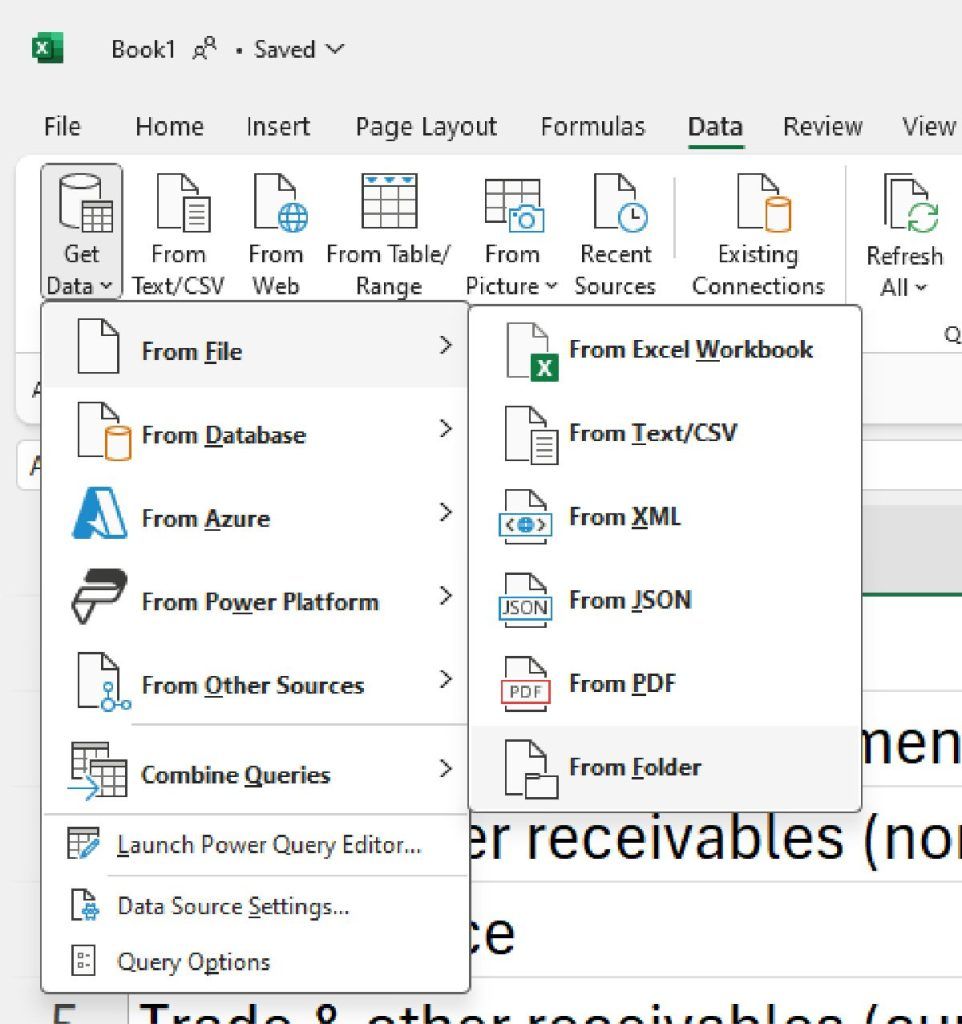
Choose the folder where you saved all the trial balances. Avoid saving the consolidation worksheet in the same folder, as it may cause issues and is simply not neat. Then click Combine & Transform Data.
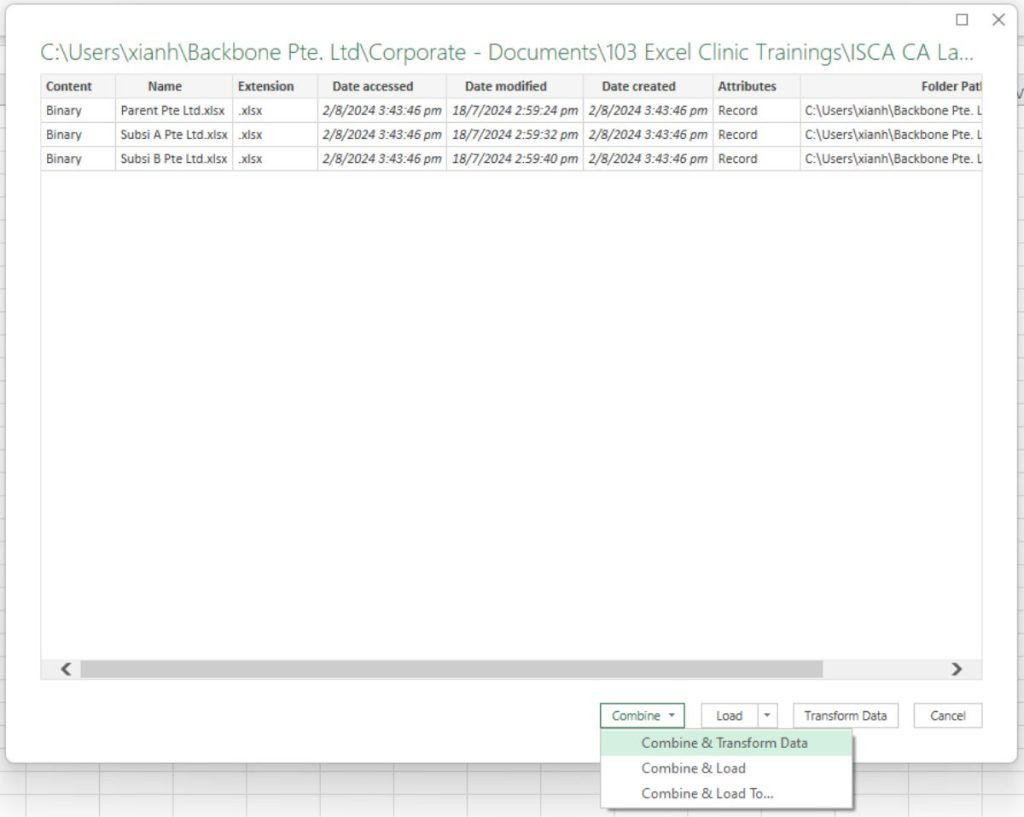
Select the worksheet which contains the trial balance and click OK.
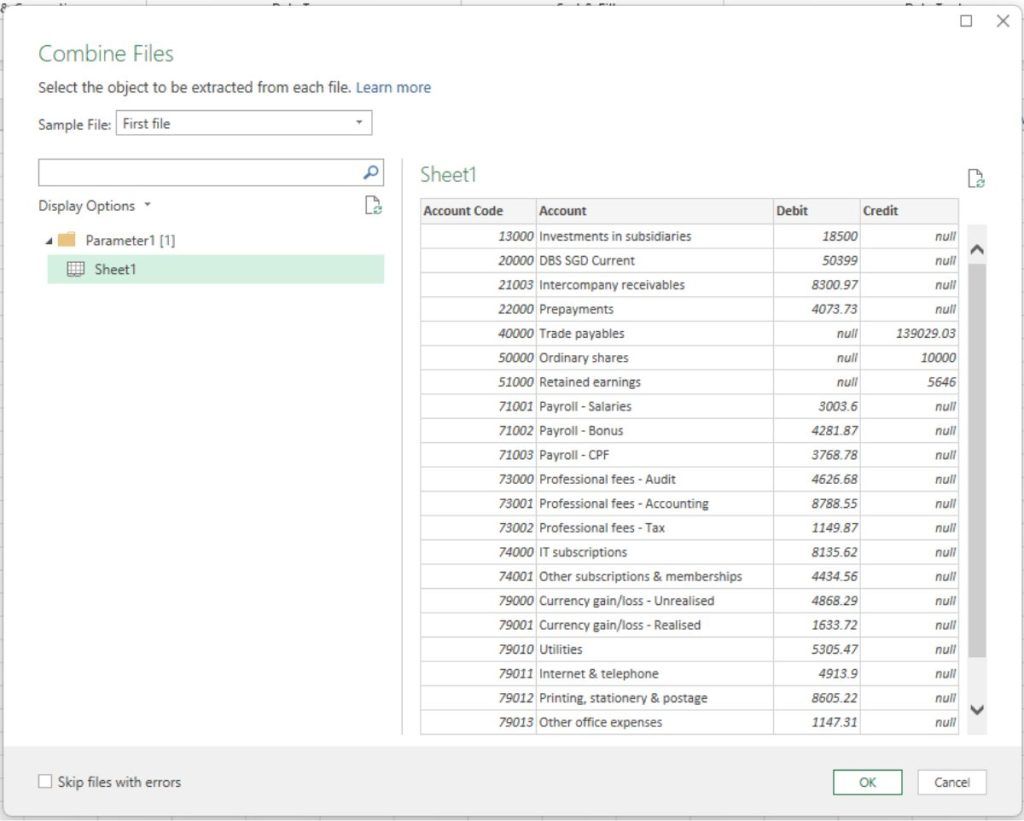
This will bring you to the Power Query Editor, a low-code, intuitive user interface.
3. How do you cleanse the data?
All the data from the files are now pulled into a table, one group entity after another, in a flat format. Do not worry if you do not like the format; this is just the backend. You will perform further manipulation to produce a consolidation worksheet in the format shown at the start.
If your accounting software produces separate debit and credit columns in the trial balance, you need to collapse them into a single column, with positive numbers representing debit balances and negative numbers representing credits. Having two separate columns for the amounts is not convenient for subsequent manipulation. If your accounting system has already collapsed the balances into one column, you can skip this step.
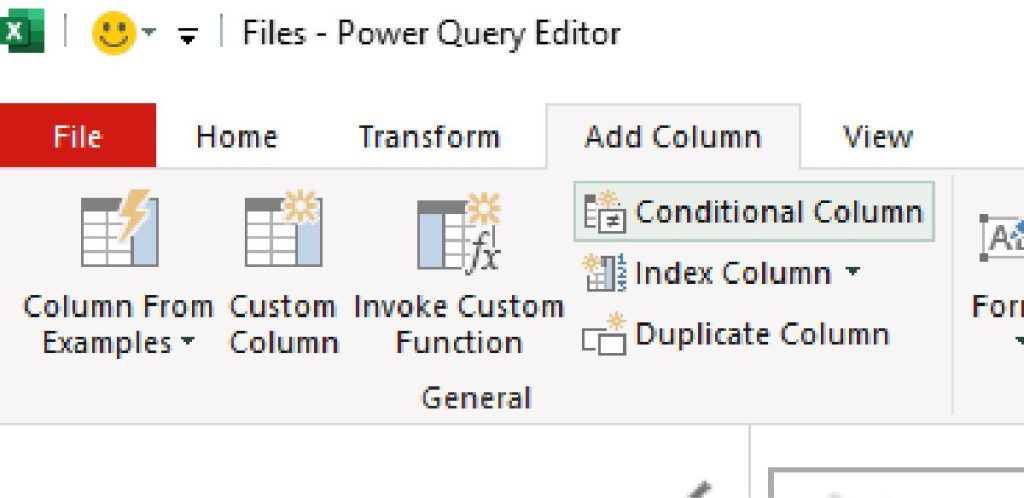
To collapse the debits and credits into a net column, go to the Add Column tab and click on Conditional Column.
The logic here is:
If [Debit] does not equal null, return [Debit]
Otherwise, return [Credit]
When entering the Output and Else fields, click on the dropdown box, choose "Select a column", then select the respective column.
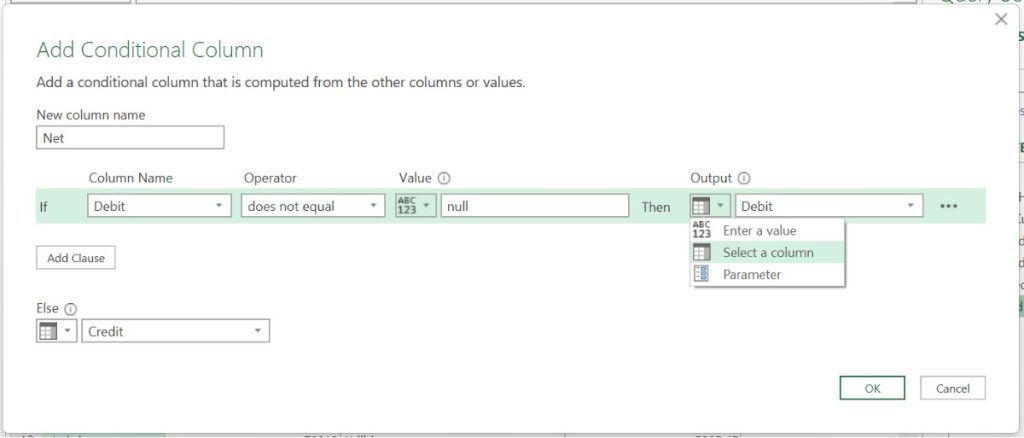
After you have everything set up as shown, click OK. You should see a new column called "Net", and a new applied step will appear in the right pane.
However, there is an issue: in the Net column, credits are also presented as positive numbers. To change credits to negative values, go to the formula bar and add a minus sign before [Credit], then press Enter:
= Table.AddColumn(#"Previous Step", "Net", each if [Debit] <> null then [Debit] else -[Credit])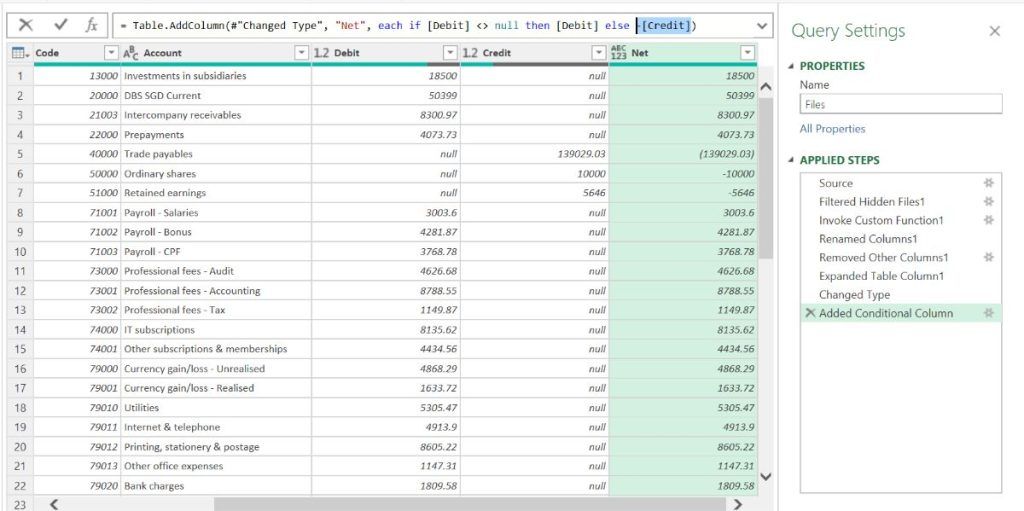
You can explore other transformation functions to address any additional data cleansing needs. Beyond the Transform and Add Column tabs in the ribbon, you will find more functions hidden in the right-click menu of the column headers.
4. How do you load the result into a report?
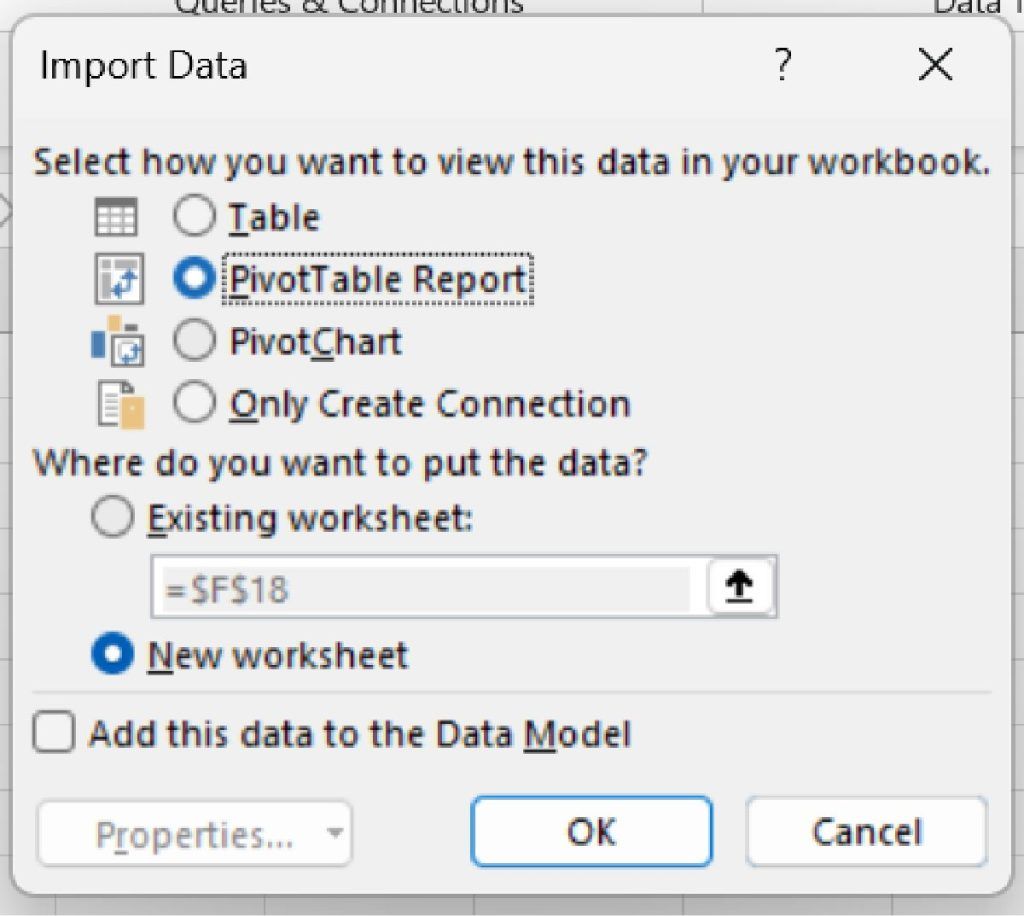
After cleansing the data, it is time to load it into a report. Go to the Home tab, click on the arrow beside Close & Load, then select Close & Load To. Select PivotTable report.
5. How do you set up the pivot table?
Set up the pivot table in the following manner:
- Rows: Account code and Account
- Columns: Source.Name (which represents the group entity names)
- Values: Net
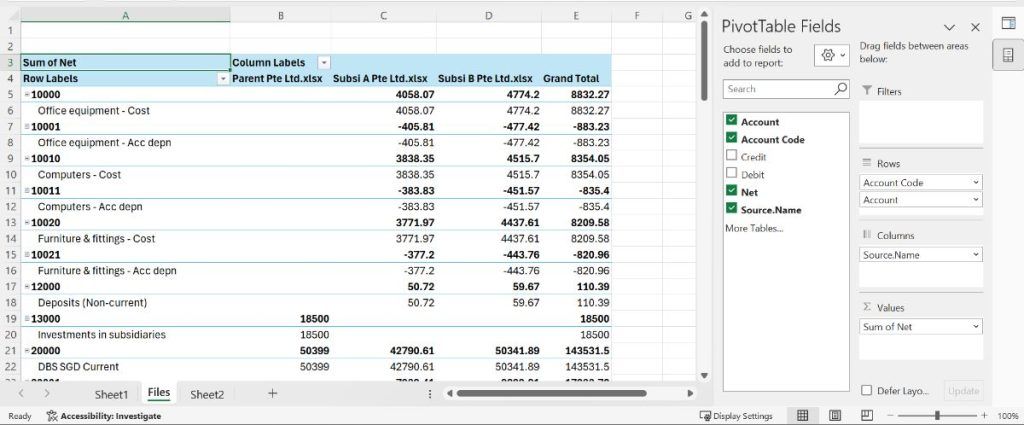
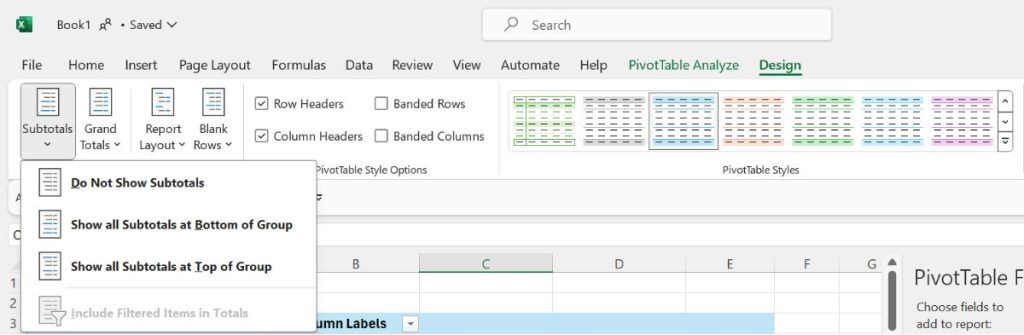
I recommend further formatting the pivot table. First, remove all subtotals, as they are not needed here. Go to the Design tab, click on the Subtotals menu, and select "Do Not Show Subtotals".
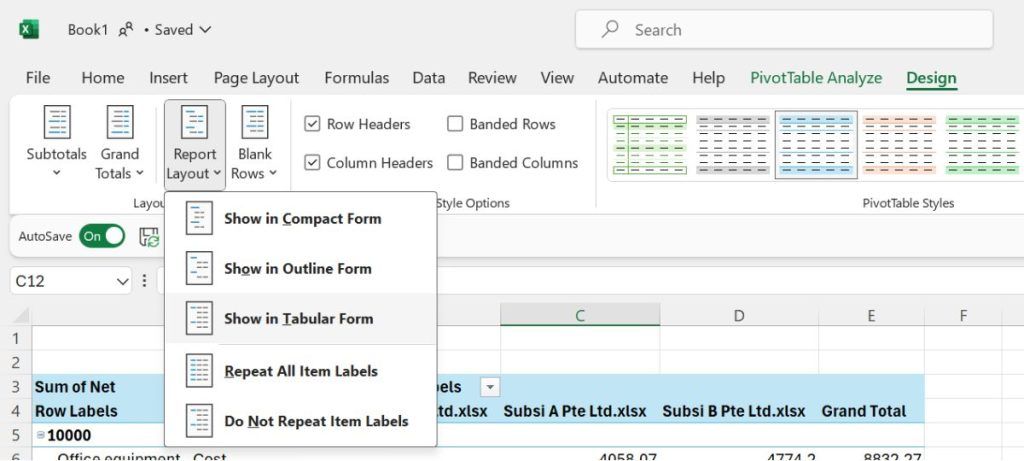
Next, in the Design tab, go to the Report Layout menu and select "Show in Tabular Form".
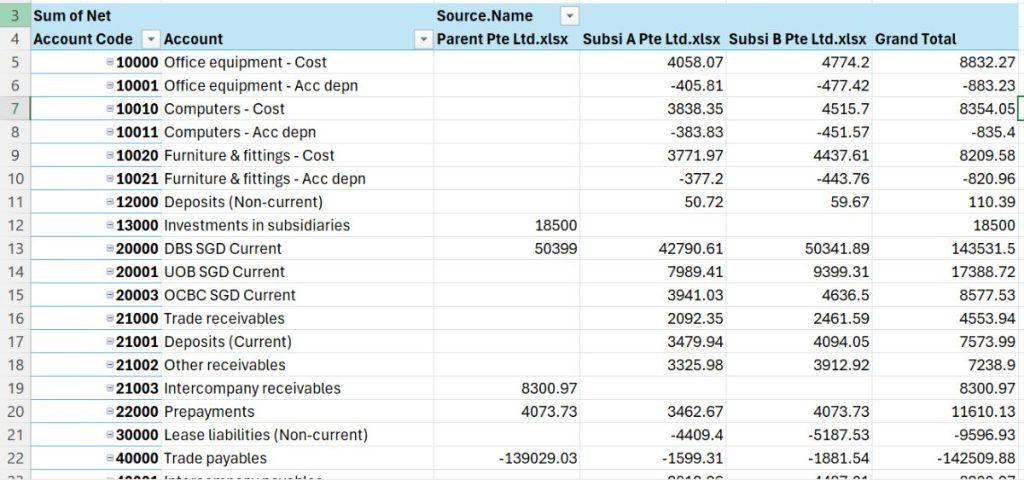
The end result will look like this:
How does refreshing work each reporting cycle?
In the next cycle, all you need to do is extract the updated trial balances and save them in the same folder. Then go to the Data tab and click Refresh. The task that used to take minutes or even hours is now done within seconds.
What should you consider before you start?
We jumped ahead a bit by diving straight into the steps. Before you start implementing Power Query for consolidation, make sure to read the following points.
Should you consolidate at the GL account level?
I prefer to consolidate at the general ledger (GL) account level, though some prefer the financial statement caption level. Consolidating at the GL account or trial balance level gives you more detailed information in the consolidation worksheet.
It may seem like a lot more work to operate at such a granular level. However, if you train your assistant (Excel) properly, the additional effort required from you is not that significant. Excel will do the work. Even if you have 1,000 GL accounts, Excel can handle it quickly. When you need a breakdown of a financial statement caption, it is readily available.
To generate the consolidated primary statements, you will need to map each account to the respective financial statement captions. Based on that mapping, you can generate the primary statements using functions such as Excel lookup functions. If you want to explore Power Query further, you can even load the mapping into Power Query and merge it with the consolidated trial balance to generate a primary statement.
Why does a common chart of accounts matter?
To perform a meaningful trial balance consolidation, all entities within the group should adopt a common chart of accounts. This may seem intuitive but, in practice, it is not always the case. It is particularly true in small and medium-sized enterprises (SMEs) and startups, where things move quickly and the importance of a common chart of accounts is often overlooked.
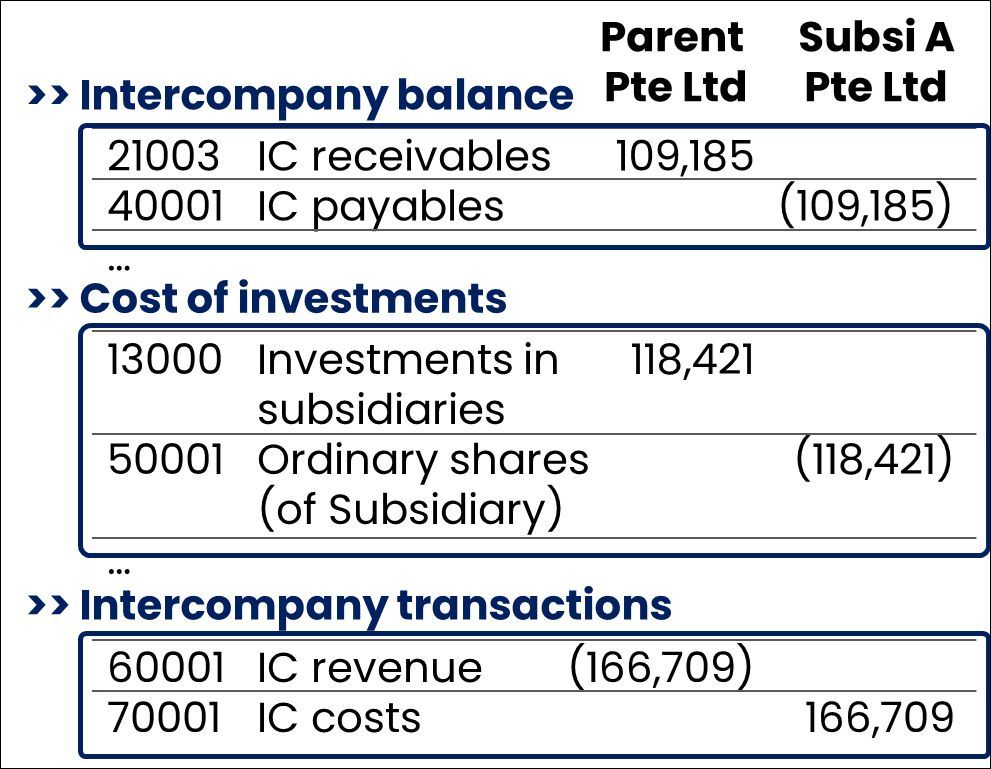
It is also crucial to use dedicated accounts for intercompany balances and transactions that are subject to elimination. These should not be mixed with external transactions.
What about intercompany elimination?
You might be wondering: did I miss out on the elimination? In school, we were taught to pass consolidation journal entries to eliminate intercompany balances. However, unless you are dealing with a more complex group, you can achieve what I call natural elimination by grouping them. This is why it is essential to have dedicated accounts for intercompany balances and transactions.
In your mapping table, map the intercompany accounts to the same caption, allowing them to be naturally eliminated. This way, in your final output, those intercompany accounts will be netted to zero.
How do you handle other elimination adjustments?
If you need a dedicated elimination column for unrealised profits or other adjustments, consider adding another trial balance file in the folder for an adjustment "entity". Power Query will treat it like any other entity and bring it into the consolidation.
The bottom line
Some accounting tasks, like data preparation for consolidation, can be mundane and time-consuming. However, with the right tools (not necessarily the most sophisticated ones) and the right approach, you can let computers do what they excel at. This reflects a wider view on the right tools for accounting, freeing up time for human accountants to continue adding value in areas that require our expertise.
Frequently asked questions
This information has been prepared for general informational purposes only and is not intended to be relied upon as accounting, tax, or other professional advice.
Related articles
articles
Artificial Intelligence in Excel
How accountants can push Excel further with artificial intelligence, from built-in tools such as Flash Fill and Analyze Data to third-party AI services connected through APIs and add-ins.
articles
Automating the Final Mile of Report Generation
A beginner-friendly guide to using VBA in Excel to automate the final mile of report generation — decoupling a finished report from its working file so it is accurate, well formatted and ready to share.
articles
Dynamic Array Formulas in Excel: Unleashing the Power
How Excel dynamic array formulas such as FILTER and XLOOKUP spill results across cells, so accountants can build scalable, error-resistant templates and audit working papers.